Flood Prevention Solutions for Philippine Cities Using Dredging Technology
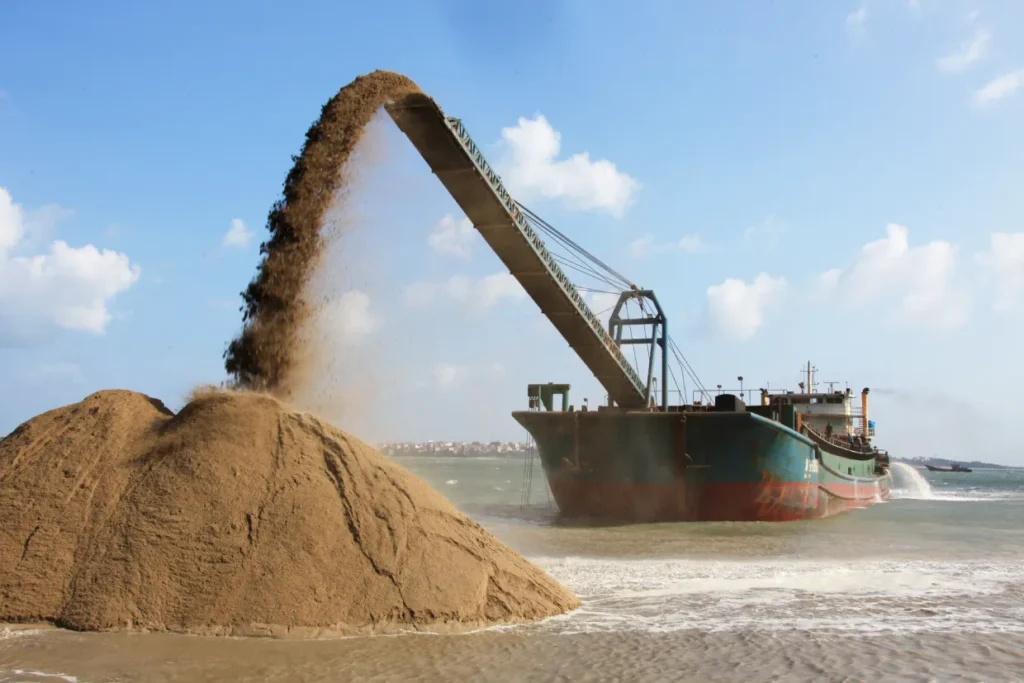
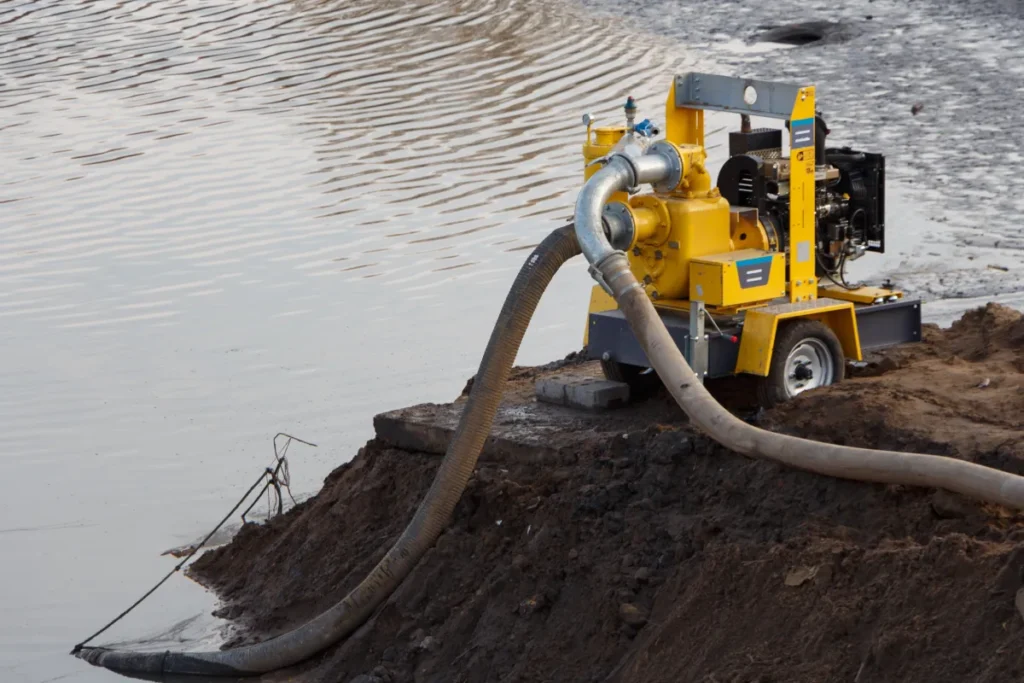
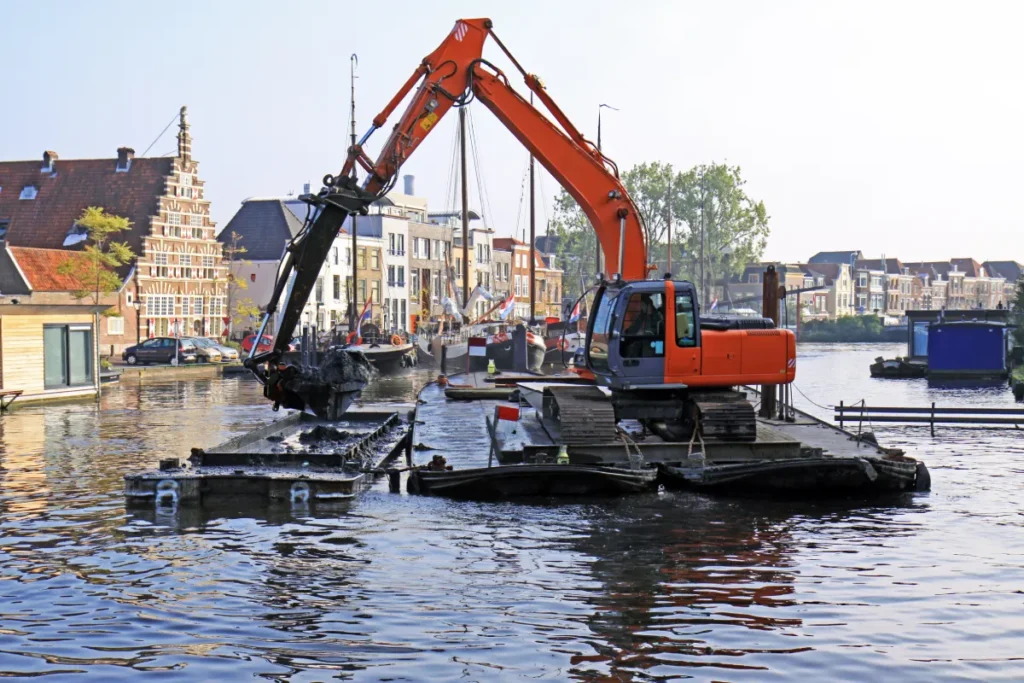
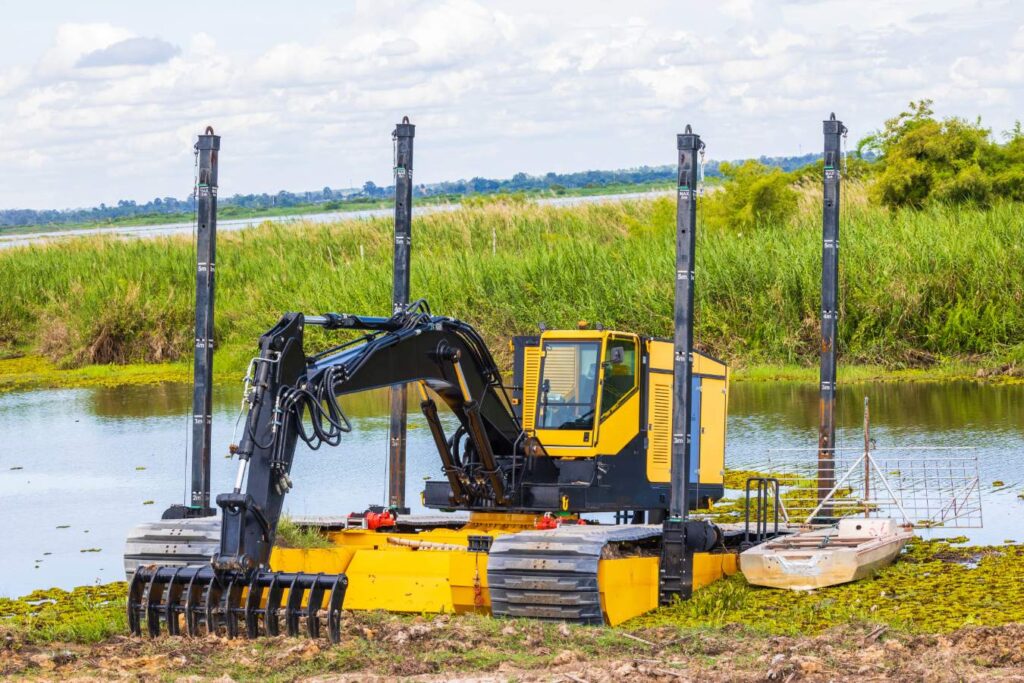
Urban flooding in the Philippines is largely driven by reduced waterway capacity. Rivers, canals, and drainage channels accumulate sediment over time, limiting their ability to convey stormwater during heavy rainfall. When flow paths are restricted, flooding occurs regardless of pumping or surface drainage upgrades. For practical flood prevention, restoring and maintaining channel capacity is a primary requirement. Dredging technology is used to remove these sediment deposits and reopen critical flow paths. In several Philippine dredging projects, dredging has been applied to rivers, lakes, and urban drainage systems to improve discharge performance during peak rain events. When planned correctly, this approach delivers measurable reductions in flood frequency and waterlogging. This blog walks you through how dredging supports flood prevention efforts in Philippine cities and the technical factors that influence project outcomes. It also explains how Dredge & Pump Pros Philippines contributes to these projects by providing dredging pumps, equipment selection support, and on-ground technical guidance suited to local conditions. Why Dredging Matters in the Philippines Most flood-prone cities in the Philippines already have rivers, canals, and drainage systems in place. The issue is not a lack of infrastructure, but a loss of capacity. Over time, sediment buildup reduces depth and flow area, especially in low-lying and coastal cities. When rainfall increases, these waterways cannot carry the required volume. This makes flood prevention a maintenance and capacity issue rather than a new construction issue. As a result, public agencies and project owners are placing greater emphasis on desilting and channel restoration. Several Philippine dredging projects now focus on removing sediment from rivers, lake inlets, drainage outfalls, and floodways to restore original design capacity. These works are often prioritized because they can be implemented more quickly than large structural upgrades and can be adjusted to site conditions. From a practical standpoint, dredging technology directly addresses sediment accumulation, a major cause of urban flooding. When dredging is planned with correct equipment selection, disposal strategy, and maintenance scheduling, it becomes a repeatable and controllable method for reducing flood risk in Philippine cities. City-level Flood Challenges and Where Dredging Fits Across Philippine cities, flooding is less about rainfall volume and more about how water moves once it reaches rivers and drainage systems. Many urban waterways were designed decades ago for lower sediment loads and different land-use conditions. Today, upstream development, erosion, and waste accumulation have changed flow behavior. Channels that once efficiently carried stormwater now slow it or back it up. In this situation, flood prevention depends on restoring flow capacity rather than expanding infrastructure. Dredging is used where waterways have lost depth, outfalls are partially blocked, or sediment has altered river profiles. These are not isolated locations but recurring conditions seen in urban rivers, lake inlets, floodways, and coastal discharge points. Most Philippine dredging projects aimed at flood control focus on targeted removal rather than full-scale excavation. The goal is to reopen critical sections that control upstream water levels. This requires selecting the appropriate dredging technology based on access limitations, sediment type, disposal distance, and maintenance frequency. Poor alignment between equipment and site conditions is a major reason flood dredging underperforms. This is where experienced suppliers matter. Dredge & Pump Pros Philippines works with project teams to match dredging pumps and systems to actual site constraints, not theoretical designs. That alignment is what allows dredging to function as a repeatable flood prevention tool instead of a one-time intervention. Dredging Technology Used for Flood Prevention Flood-related dredging is not about maximum excavation. It is about removing the right material from the right location, using equipment that can operate reliably in constrained urban environments. In Philippine flood control work, dredging is typically performed in narrow rivers, shallow lakes, drainage outfalls, and low-clearance canals. These conditions directly influence technology selection. Most flood prevention dredging projects rely on suction-based systems because they allow controlled sediment removal without disturbing surrounding structures. Cutter suction dredgers are commonly used where sediment has compacted over time and needs mechanical loosening before pumping. In tighter locations, excavator-mounted dredge pumps are preferred because they can work from riverbanks or existing platforms without large mobilization requirements. Pump performance is an important factor. Flood dredging often involves fine silt mixed with organic waste and debris. Pumps must handle variable solids content without frequent clogging or wear failures. This is why dredging systems used in Philippine dredging projects are typically paired with abrasion-resistant slurry pumps and short discharge distances to simplify operation and reduce downtime. Another key consideration is disposal. Flood control dredging usually targets shallow material removal, which means dredged sediment volumes are moderate but recurring. Dredging technology must support repeat operations, be easy to set up, and enable fast demobilization. Systems designed only for large-scale capital dredging are often inefficient for this purpose. In practice, successful flood dredging depends less on equipment size and more on correct system matching. Dredge & Pump Pros Philippines supports this approach by supplying dredging pumps and configurations suited to urban waterways, short-cycle projects, and ongoing maintenance programs, rather than one-time excavation work. How Dredging Fits into an Integrated Flood Prevention Strategy Dredging alone does not prevent flooding. It works when it is planned as part of a broader system that manages how water enters, moves through, and exits urban areas. In Philippine cities, flood control systems typically include rivers, drainage networks, pumping stations, floodgates, and retention areas. When any part of this system loses capacity, overall performance drops. Within this system, dredging has a specific role. It restores the hydraulic capacity of channels that pumps and gates depend on. If riverbeds are raised by sediment, pumps discharge less water, and gates become ineffective during high tide. In this context, flood prevention starts with ensuring that downstream waterways are clear before mechanical or structural solutions are added. Most Philippine dredging projects tied to flood control follow a targeted approach. Instead of dredging entire river lengths, work is focused on constricted sections, outfalls, and low-gradient reaches where sediment accumulates fastest. This allows dredging to support existing infrastructure rather than replace it.
Flood Prevention Solutions for Philippine Cities Using Dredging Technology Read More »